
Web Design
Website Redesign SEO: How to Relaunch Without Losing Rankings
Most ranking losses after a redesign come from a few preventable changes. This is the migration process to run alongside the design work.
Core Web Vitals are Google’s measurements of how a page feels to use: how quickly the main content appears, how quickly the page responds to input, and how much the layout moves while it loads. Most of what decides them is set during design and build, which makes them a web design topic as much as a development one.
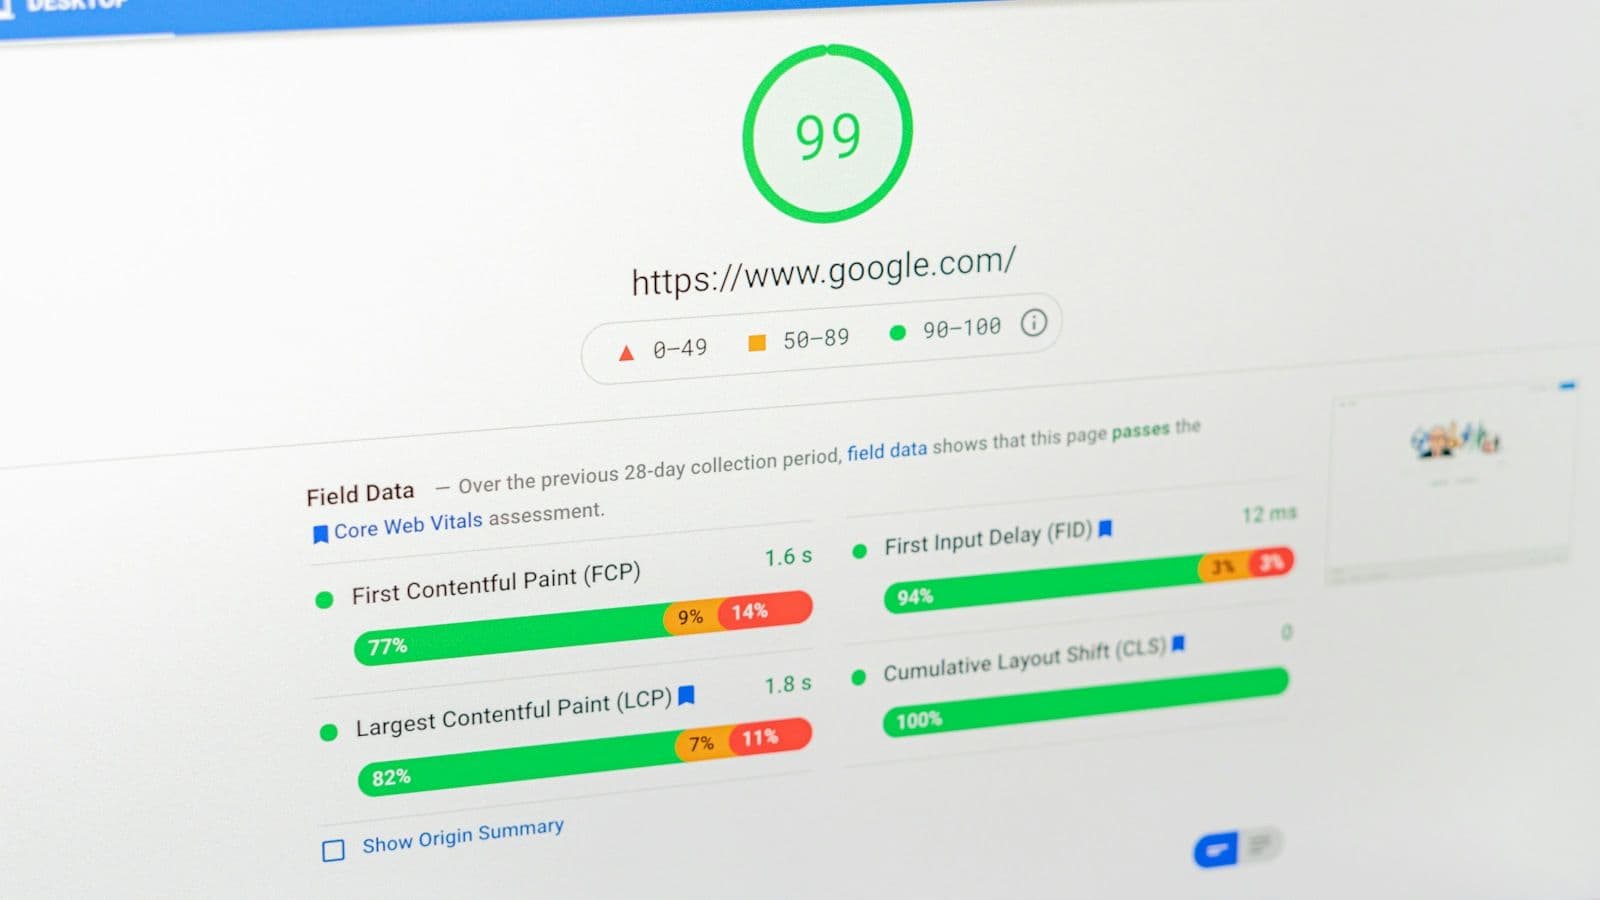
Google’s Core Web Vitals are three metrics, each covering one part of the experience of using a page: loading, responsiveness and visual stability. Each has published thresholds for “good” and “poor”, with “needs improvement” in between.
| Metric | What it measures | Good | Poor |
|---|---|---|---|
| Largest Contentful Paint (LCP) | Loading: when the largest image or text block in the viewport renders | 2.5 s or less | Over 4.0 s |
| Interaction to Next Paint (INP) | Responsiveness: the delay between a click, tap or key press and the next visual update | 200 ms or less | Over 500 ms |
| Cumulative Layout Shift (CLS) | Visual stability: how much visible content moves unexpectedly | 0.1 or less | Over 0.25 |
A page meets the standard when it reaches “good” on all three (an LCP of 2.5 seconds or less, an INP of 200 milliseconds or less and a CLS of 0.1 or less) at the 75th percentile of page loads, measured separately on mobile and desktop. In practice, three out of four real visits have to meet the target. A fast result on the designer’s own laptop says little about the slowest quarter of visitors on mid-range phones and mobile networks.
INP became a Core Web Vital on March 12, 2024, replacing First Input Delay (FID). FID measured only the delay before the first interaction was handled; INP considers interactions across the whole visit, so a page that passed on FID does not necessarily pass on INP. Older reports and screenshots, including the one in the photograph above, still show FID.
Passing is not the norm. The HTTP Archive’s 2025 Web Almanac found good Core Web Vitals on 48% of mobile websites and 56% of desktop websites. On mobile, LCP was the hardest of the three: 62% of sites had a good LCP, against 77% for INP and 81% for CLS.
Core Web Vitals are field metrics. The figures Google uses come from the Chrome UX Report (CrUX), which aggregates measurements from real Chrome users as a 28-day rolling average. That window is why a fix shows up in Search Console gradually rather than the day after it ships.
Lab tools such as Lighthouse load a page once in a controlled, simulated environment. They are for diagnosing problems and testing changes before release. A standard lab run measures LCP and CLS but never interacts with the page, so it cannot report INP; Total Blocking Time (TBT) is the lab metric that stands in for it. To measure INP during development, interact with the page while the Chrome DevTools Performance panel records; it captures INP for your own interactions.
| Tool | Data | Use it to |
|---|---|---|
| PageSpeed Insights | Field data from CrUX and a Lighthouse lab run, for one URL | Check a page’s real-user results and diagnostics in one place |
| Search Console Core Web Vitals report | Field data from CrUX, grouped by similar URLs | Find which templates fail across a whole site |
| Lighthouse and Chrome DevTools | Lab data | Diagnose causes and test fixes before launch |
| The web-vitals JavaScript library | Field data from your own visitors | Measure pages CrUX does not cover, and see which elements cause problems |
CrUX does not cover every site. It includes only publicly discoverable pages with enough traffic from Chrome users who share usage statistics, and it excludes Chrome on iOS. New sites and low-traffic pages often have no field data at all, and Search Console shows nothing for them. For those pages, collecting your own measurements with the web-vitals library is the only way to see real-user results. Since Safari 26.2 added support for LCP and INP in December 2025, those measurements can include Safari visitors too.
Google confirms that “Core Web Vitals are used by our ranking systems”, as one part of page experience. The same documentation is careful about their weight: good scores do not guarantee top rankings, and “Google Search always seeks to show the most relevant content, even if the page experience is sub-par.” Where many pages are similarly helpful for a query, Google says a great page experience “can contribute to success in Search”.
The accurate way to explain this to a client is that Core Web Vitals help most when competing pages are otherwise close, and that their larger effect is on visitors. A page that loads slowly or moves under the reader’s thumb loses people whether or not it loses rankings, which makes user experience the stronger business case for the work.
LCP marks when the largest image or text block in the viewport finishes rendering. On most marketing sites that is the hero image, a video poster frame, or the main headline. Google’s LCP optimization guide divides the time into four parts, and each points to a different fix.
| Part | What is happening | How to reduce it |
|---|---|---|
| Time to First Byte | The server returns the HTML | Caching, a CDN, faster hosting, no redirect hops |
| Resource load delay | The browser has not started loading the LCP image yet | Put the image in the HTML, never lazy-load it, and add fetchpriority="high" |
| Resource load duration | The image is downloading | Responsive image sizes, AVIF or WebP, compression matched to display size |
| Element render delay | The image or text has loaded but is not yet painted | Less render-blocking CSS and JavaScript; no client-side rendering of the hero |
The same guide gives a useful rule: the LCP resource should start loading at the same time as the first resource the page loads. Anything that makes the browser discover the hero late breaks that rule. The common design-side causes are:
<img> element, or preload the image with a high fetch priority.INP measures the time from a click, tap or key press to the next frame the browser paints, and reports close to the slowest interaction of the visit. Hovering, scrolling and zooming are not counted. The time splits into three phases: input delay, processing duration and presentation delay. That is the wait before the event handlers start, the time they take to run, and the time until the browser paints the result.
A slow INP almost always means the browser’s main thread was busy running JavaScript when the visitor acted. Google defines any task that runs longer than 50 milliseconds as a long task, because it stops the browser from responding. On agency-built sites the cause is usually accumulation rather than one bad script: a page builder’s runtime, a tag manager with several marketing tags, a chat widget, a consent banner, an A/B testing tool and an animation library, all competing for the same thread.
scheduler.yield() is available in Chromium browsers and Firefox, with setTimeout as the fallback elsewhere.Mega menus, filter panels, accordions and add-to-cart buttons are the usual INP problems, because they run the most code on interaction. Test them on a mid-range Android phone, not only on a desktop.
CLS measures how much visible content moves without the visitor causing it. Each unexpected shift is scored by how much of the viewport moves and how far. Shifts are grouped into session windows (bursts with less than a second between shifts, up to five seconds long), and the page’s CLS is its worst window. Shifts within 500 milliseconds of a tap, click or key press are excluded, so content that expands because the visitor asked for it does not count.
width and height attributes, or a CSS aspect-ratio, on images, video and iframes so the browser reserves space before the file arrives. Keep the same aspect ratio across every size in a srcset.size-adjust and the related font descriptors so the fallback font takes up the same space as the web font, or font-display: optional where the brand allows it.transform and opacity rather than top, left or height, which change the layout.Most Core Web Vitals problems are designed in before they are coded, so the cheapest place to prevent them is the design review. The table maps common choices to the metric they put at risk and an alternative that keeps the design intent.
| Design choice | Metric at risk | Alternative |
|---|---|---|
| Autoplaying video or a carousel as the hero | LCP | One optimized still image as the hero; video further down the page or on request |
| Hero image applied as a CSS background | LCP | An img element with responsive sizes and fetchpriority="high" |
| Several font families and weights | LCP, CLS | One or two families, a variable font, and matched fallbacks |
| Announcement bar or consent banner inserted above the header | CLS | Space reserved in the layout, or an overlay that does not move content |
| Maps, videos and review widgets without fixed dimensions | CLS | Containers with a fixed aspect ratio |
| Chat, heatmap and marketing scripts on every page | INP | Load them only where they are needed, after the page is interactive |
| Scroll-triggered animation on every section | INP, CLS | Fewer animations, using transform and opacity only |
| Menus and filters built with heavy client-side code | INP | Server-rendered markup with light interaction scripts |
Performance is cheaper to design in than to retrofit, and easier to protect when it is part of the project scope.
Core Web Vitals are one section of a full technical SEO audit, and a redesign is the best opportunity to fix them; the website redesign SEO checklist covers the rest of that launch.
Most ranking losses after a redesign come from a few preventable changes. This is the migration process to run alongside the design work.
The order to check a site in — crawl, render, index, understand — what to look for at each step, and how to turn the findings into fixes a client approves.

The subscription line is the small half of what a scattered stack costs. Here is the audit that prices the other half, and the rule for deciding what to cut.